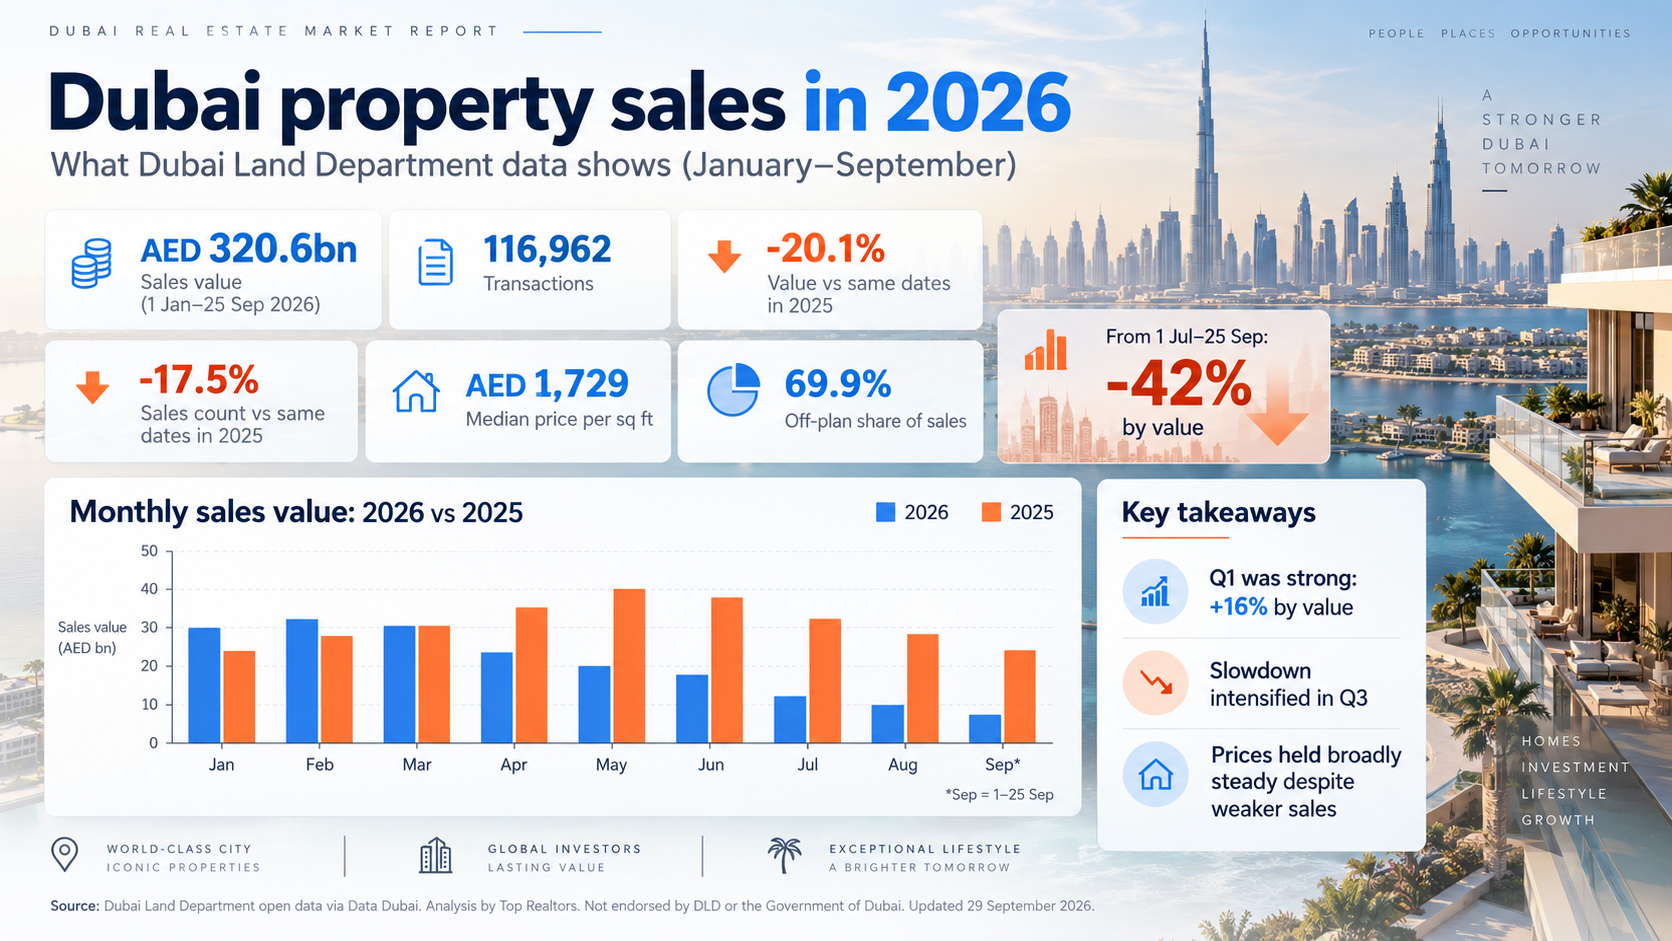
Dubai property sales registered with the Dubai Land Department reached AED 320.6bn across 116,962 transactions between 1 January and 25 September 2026, 20% less by value than the same dates in 2025. A strong first quarter gave way to a sharp slowdown: sales from 1 July were 42% lower by value.
- Year to date: AED 320.6bn and 116,962 sales, −20% by value and −17% by count (AED 401.4bn and 141,719 in 2025).
- Two halves: the first quarter was +16% by value; 1 July–25 September was −42% (34,643 sales against 52,707).
- Prices held: the median price per sq ft of apartments, offices and shops was AED 1,729 against AED 1,701 (+1.6%).
- Off-plan share rose: 69.9% of sales were off-plan (64.7% in 2025), because ready (resale and completed) sales fell faster.
How much property was sold in Dubai in 2026?
From 1 January to 25 September 2026, DLD registered 116,962 property sales worth AED 320.6bn. Over the same dates in 2025 it registered 141,719 sales worth AED 401.4bn. That is 20.1% less money and 17.5% fewer transactions.
These are registrations of sales of every kind that DLD counts as a sale: off-plan purchases from developers, resales of completed homes, land, offices and shops. Mortgages and gifts are not included. The typical transaction also got a little smaller: the median sale was AED 1.41m, against AED 1.49m a year earlier.
| 2026 (1 Jan–25 Sep) | 2025 (1 Jan–25 Sep) | Change | |
|---|---|---|---|
| Sales value | AED 320.6bn | AED 401.4bn | −20.1% |
| Number of sales | 116,962 | 141,719 | −17.5% |
| Median sale price | AED 1.41m | AED 1.49m | −5.7% |
| Median price per sq ft (units) | AED 1,729 | AED 1,701 | +1.6% |
| Off-plan share of sales (count) | 69.9% | 64.7% | |
| Off-plan share of value | 56.3% | 49.7% |
Source: Dubai Land Department open data via Data Dubai. Analysis by Top Realtors; not endorsed by the Dubai Land Department or the Government of Dubai.
Month by month: a strong start, then a slowdown
January and February 2026 were each well ahead of a year earlier (+32% and +18% by value). March was flat. From April the comparison turned negative, and from May every month has been between 30% and 46% below the same month of 2025.
Source: Dubai Land Department open data via Data Dubai. Analysis by Top Realtors; not endorsed by the Dubai Land Department or the Government of Dubai.
| Month | 2026 AED bn | 2025 AED bn | Value change | 2026 sales | 2025 sales | Count change |
|---|---|---|---|---|---|---|
| January | 49.5 | 37.6 | +32% | 15,871 | 12,909 | +23% |
| February | 51.0 | 43.1 | +18% | 16,405 | 14,786 | +11% |
| March | 40.2 | 40.7 | −1% | 13,446 | 14,232 | −6% |
| April | 43.1 | 48.2 | −11% | 13,553 | 15,960 | −15% |
| May | 26.8 | 49.4 | −46% | 10,015 | 16,249 | −38% |
| June | 28.2 | 41.7 | −32% | 13,029 | 14,876 | −12% |
| July | 32.2 | 55.8 | −42% | 13,461 | 19,068 | −29% |
| August | 25.8 | 44.5 | −42% | 11,678 | 17,430 | −33% |
| September (1–25) | 23.8 | 40.5 | −41% | 9,504 | 16,209 | −41% |
Source: Dubai Land Department open data via Data Dubai. Analysis by Top Realtors; not endorsed by the Dubai Land Department or the Government of Dubai.
The quarters side by side
| Period | 2026 AED bn | 2025 AED bn | Value change | 2026 sales | 2025 sales | Count change |
|---|---|---|---|---|---|---|
| Q1 (Jan–Mar) | 140.7 | 121.3 | +16% | 45,722 | 41,927 | +9% |
| Q2 (Apr–Jun) | 98.0 | 139.2 | −30% | 36,597 | 47,085 | −22% |
| 1 Jul–25 Sep | 81.9 | 140.9 | −42% | 34,643 | 52,707 | −34% |
Source: Dubai Land Department open data via Data Dubai. Analysis by Top Realtors; not endorsed by the Dubai Land Department or the Government of Dubai.
Taken as a half-year, January to June was only 8.4% down by value, because the first quarter was so strong. The steep part of the fall is recent: 34,643 sales from 1 July to 25 September, against 52,707 a year earlier.
Is the slowdown real, or are recent sales still being registered?
It is a fair question for any recent data. Some sales reach the register later than the deal date, and the open-data file is refreshed over time, so the latest weeks could look weaker than they will once everything is in. We checked this two ways.
Weekly counts are steady, not tailing off. In each of the last eight weeks to 25 September 2026, DLD registered between 2,375 and 3,045 sales. The same weeks of 2025 had between 3,074 and 4,872. If late registration were the main explanation, we would expect the final week or two to be much lower than the weeks before; they are not.
| Week (2026 dates) | 2026 sales | 2025 sales (same dates) | Change |
|---|---|---|---|
| 1 Aug–7 Aug | 3,045 | 3,943 | −23% |
| 8 Aug–14 Aug | 2,707 | 4,183 | −35% |
| 15 Aug–21 Aug | 3,003 | 4,538 | −34% |
| 22 Aug–28 Aug | 2,476 | 4,174 | −41% |
| 29 Aug–4 Sep | 2,390 | 4,222 | −43% |
| 5 Sep–11 Sep | 2,798 | 3,074 | −9% |
| 12 Sep–18 Sep | 2,388 | 4,633 | −48% |
| 19 Sep–25 Sep | 2,375 | 4,872 | −51% |
Source: Dubai Land Department open data via Data Dubai. Analysis by Top Realtors; not endorsed by the Dubai Land Department or the Government of Dubai.
The pattern survives a wider definition. Our headline figures cover property that DLD tags as residential or commercial. DLD tags some villa-plot sales by land zoning instead (for example ‘Multi-Use’ or ‘Other’), so we repeated the calculation with every usage except industrial, agricultural and storage. On that wider basis the first half was −12.3% and 1 July–25 September −44.1% by value; the shape is the same.
Late registrations can still add to recent months when DLD updates the file, so treat the July–September figures as a floor. We will rerun the numbers with each quarterly refresh.
Off-plan or ready: which side fell?
Over the whole period, ready property took the bigger hit. Sales of completed homes and other ready property fell to 35,229 (AED 140.0bn, −31% by value), while off-plan sales were worth AED 180.6bn (−9%). That is why the off-plan share rose to 69.9% of transactions.
The year-to-date figure hides two different halves for off-plan. In the first quarter, off-plan sales were worth 44% more than a year earlier. From 1 July to 25 September they were 46% lower, a steeper fall than ready property’s 37% over the same weeks.
Source: Dubai Land Department open data via Data Dubai. Analysis by Top Realtors; not endorsed by the Dubai Land Department or the Government of Dubai.
| 2026 sales | 2025 sales | 2026 value | 2025 value | Value change | Median AED/sq ft 2026 | 2025 | |
|---|---|---|---|---|---|---|---|
| Off-plan | 81,733 | 91,738 | AED 180.6bn | AED 199.3bn | −9% | AED 1,792 | AED 1,848 |
| Ready (completed) | 35,229 | 49,981 | AED 140.0bn | AED 202.1bn | −31% | AED 1,420 | AED 1,350 |
Source: Dubai Land Department open data via Data Dubai. Analysis by Top Realtors; not endorsed by the Dubai Land Department or the Government of Dubai.
One caution on these labels. DLD marks a sale as off-plan or ready at registration. Some purchases from developers are registered only at handover (DLD’s ‘Delayed Sell’ procedure) and carry the ready tag, so the off-plan share slightly understates how much of the market is new stock sold by developers.
If you are weighing the two, our guide to off-plan specialist brokers in Dubai covers who handles developer launches, and our off-plan developer guide shows which developers rely most on off-plan sales.
Did Dubai property prices fall in 2026?
Not on the median. The median price per sq ft of units sold (apartments, offices and shops) was AED 1,729, against AED 1,701 in 2025, a change of +1.6%. For ready units it rose from AED 1,350 to AED 1,420; for off-plan units it eased from AED 1,848 to AED 1,792.
Two things to keep in mind. First, a median describes what sold, not what an identical home is worth: if more small or cheaper-located units sell, the median falls even when no individual price has moved, and the reverse. Second, the median sale price fell (AED 1.41m against AED 1.49m) while the price per sq ft held, which points to smaller or differently located units making up more of the sales, not to falling prices. A proper price index controls for this; a median does not.
Off-plan units still cost more per sq ft than ready ones (AED 1,792 against AED 1,420), mainly because new stock is newer and often in different locations. That gap is a mix effect, not a guaranteed premium.
What kind of property sold?
Homes drove the fall. Sales of property that DLD tags as residential were worth AED 247.3bn, −25% on 2025. Offices went the other way: 3,608 office sales worth AED 19.9bn, more than double the AED 8.2bn of a year earlier. Our commercial real estate broker guide covers who handles office deals.
| Property type | 2026 AED bn | 2025 AED bn | Value change | 2026 sales | 2025 sales | Count change |
|---|---|---|---|---|---|---|
| Apartments and hotel apartments (units, excl. offices and shops) | 174.5 | 225.8 | −23% | 95,505 | 116,780 | −18% |
| Villas and townhouses | 52.6 | 60.5 | −13% | 10,844 | 11,819 | −8% |
| Land (plots) | 59.8 | 88.8 | −33% | 5,517 | 8,796 | −37% |
| Offices | 19.9 | 8.2 | +141% | 3,608 | 2,936 | +23% |
| Shops | 4.9 | 2.6 | +90% | 1,197 | 989 | +21% |
| Whole buildings | 9.0 | 15.5 | −42% | 291 | 399 | −27% |
Source: Dubai Land Department open data via Data Dubai. Analysis by Top Realtors; not endorsed by the Dubai Land Department or the Government of Dubai.
Land sales fell by a third by value. Some villa-plot sales on new master communities are tagged ‘Commercial’ by DLD rather than residential (Palm Jebel Ali is the clearest case), so land and commercial totals include some future homes.
Where did the money go?
DLD records location by its own area names, which are often not the names buyers use. The ten areas with the highest sales value this year were:
| DLD area (what it covers) | 2026 AED bn | Value change | 2026 sales |
|---|---|---|---|
| Business Bay | 20.6 | −24% | 4,714 |
| Madinat Al Mataar (Dubai South) | 16.9 | +23% | 13,323 |
| Hadaeq Sheikh Mohammed Bin Rashid (Dubai Hills area) | 12.5 | −18% | 1,982 |
| Palm Deira (Dubai Islands) | 12.2 | −12% | 3,316 |
| Al Yelayiss 1 (DAMAC Islands 2) | 12.1 | from AED 0.93bn | 3,583 |
| Palm Jumeirah | 11.3 | −27% | 793 |
| Wadi Al Safa 3 (Majan and nearby) | 11.1 | −31% | 5,545 |
| Jabal Ali First (Al Furjan, Wasl Gate) | 10.2 | −21% | 5,171 |
| Wadi Al Safa 5 (Dubailand Residence Complex) | 10.2 | −38% | 6,060 |
| Marsa Dubai (Dubai Marina, JBR, Dubai Harbour) | 9.9 | −57% | 2,384 |
Source: Dubai Land Department open data via Data Dubai. Analysis by Top Realtors; not endorsed by the Dubai Land Department or the Government of Dubai.
Business Bay led on value but its number of sales fell by more than half. The biggest established names slowed sharply: Marsa Dubai (Dubai Marina, JBR and Dubai Harbour) was down 57% by value, Burj Khalifa (the DLD area for Downtown Dubai) 51%, and Al Barsha South Fourth (Jumeirah Village Circle) 42%, although JVC still had 7,614 sales, more than any other established community. The growth came from new off-plan districts such as Madinat Al Mataar (Dubai South) and DAMAC Islands 2.
Which developers sold the most?
The ten developers with the highest sales value took 46.0% of the market this year; in 2025 the ten largest took 43.6%. We rank developers on this data in our Dubai property developer ranking, with the method and the caveats that go with it. The most important one: DLD’s open data has no developer column, so we attach developers through project records, and a newer project that is missing from the published project file has to be matched by rules or checked by hand. Developer totals are therefore lower bounds; 16% of 2026 sales value could not be attributed to any developer.
If you are choosing an agent rather than a developer, our ranked list of Dubai brokerages explains how we rank them.
What this data cannot tell you
- Why sales slowed. Registration data shows what happened, not the cause. We have not attributed the slowdown to any event, because we have no cited source that establishes one.
- Price changes for a given home. Medians reflect the mix of what sold. They are not a price index.
- Rents and yields. These figures cover sales only. We have not yet analysed DLD’s rental contract data, so we make no yield claims.
- Final numbers. Late registrations can raise recent months when DLD updates the file.
- Company-reported sales. Registered values are not developers’ booking figures and will not match their own announcements.
Frequently asked questions
How much property was sold in Dubai in 2026?
Between 1 January and 25 September 2026, the Dubai Land Department registered 116,962 property sales worth AED 320.6bn, according to our analysis of DLD open data. That was 20% lower by value and 17% lower by count than the same dates in 2025.
Is the Dubai property market slowing down in 2026?
Sales volumes slowed from April. The first quarter was +16% by value on 2025, but sales from 1 July to 25 September were 42% lower. Weekly counts in the last eight weeks were steady, so the fall is not just late registration.
Did Dubai property prices drop in 2026?
Not on the median. The median price per sq ft of units sold was AED 1,729 in 1 January–25 September 2026, against AED 1,701 in the same period of 2025 (+1.6%). A median reflects the mix of what sold, so it is not a precise price index.
What share of Dubai property sales are off-plan in 2026?
69.9% of sales registered from 1 January to 25 September 2026 were off-plan, up from 64.7% a year earlier. By value, off-plan was 56.3% of the total. The share rose because ready-property sales fell faster.
Where does this data come from?
From the Real Estate Transactions dataset that the Dubai Land Department publishes on Data Dubai. Top Realtors filtered it to sales registrations and analysed it; DLD has not reviewed or endorsed the analysis. The method section below sets out the definitions.
Sources
- Data Dubai: Real Estate Transactions (Dubai Land Department) (all sales figures; file loaded by DLD on 29 September 2026, latest registration date 25 September 2026)
- Data Dubai: Real Estate Projects (Dubai Land Department) and Data Dubai: Developers Recorded in DLD (developer attribution only)
- Dubai Land Department: Property Sale Registration (what a sale registration is)
Leave a Reply